

In today’s competitive business environment, relying on guesswork is risky. Analytics & reporting convert raw data into actionable insights, helping businesses track performance, improve strategies, and make smarter decisions. Companies that embrace data outperform those that don’t, making analytics an essential part of modern business.
Why Analytics & Reporting Are Essential
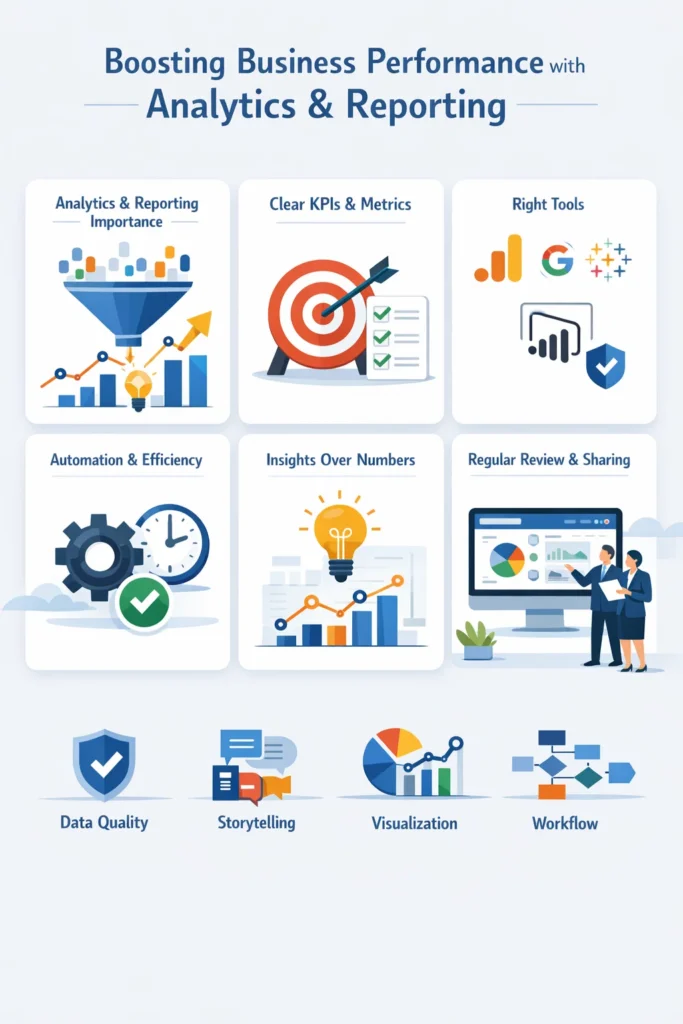
Analytics and reporting are more than numbers—they provide a clear view of business performance. With effective business analytics and SEO insights, companies can identify trends, monitor KPIs, improve ROI, and make confident, data-driven decisions. Reliable reporting tools transform complex datasets, including SEO performance data, into dashboards your team can act on quickly.
Define Clear KPIs and Metrics
The first step is knowing what truly matters. KPIs and metrics guide your strategy and ensure your team focuses on actionable data.
Choose measurable KPIs tied to your goals, such as revenue growth, lead conversions, or website engagement. Focus on a few critical metrics rather than tracking everything. Tools like Google Analytics or HubSpot make KPI tracking efficient and simple. Clear KPIs turn analytics into actionable insights instead of overwhelming numbers.
Use the Right Reporting Tools
Selecting the right tools simplifies data collection and improves accuracy. Reporting tools convert raw numbers into insights, helping teams make faster decisions.
Recommended tools include:
- Google Analytics: Monitors website traffic, user behavior, and conversions.
- Tableau or Power BI: Build interactive, detailed dashboards.
- Zoho Analytics: Affordable reporting for small businesses.
Choose tools that align with your business size, budget, and technical expertise for maximum efficiency.
Automate Reports for Efficiency
Manual reporting consumes time and increases errors. Automation ensures timely, accurate insights while freeing your team for strategic work.
Set up automated weekly or monthly dashboards and enable alerts for critical KPI changes. Tools like Data Studio, Power BI, or Tableau provide real-time updates. Automation saves hours and makes performance tracking consistent and reliable.
Focus on Insights, Not Just Numbers
Data alone doesn’t improve business outcomes. Focus on extracting insights that drive action.
Identify patterns, spikes, and declines in metrics, and compare performance to historical data to detect trends. Translate insights into practical steps, such as optimizing marketing campaigns or adjusting operations. Visual dashboards make insights clear and actionable for your team.
Regularly Review and Update Reports
Reports lose value if not updated regularly. Frequent review ensures decisions are based on current information.
Review dashboards weekly or monthly and adjust KPIs as goals evolve. Ensure reports remain aligned with strategic priorities. Regular updates strengthen business analytics and keep your team focused on what matters most.
Share Reports Clearly With Your Team
Data only drives results when your team can understand and act on it. Sharing reports effectively encourages collaboration and informed decision-making.
Use visual dashboards to communicate clearly and highlight trends, successes, and areas needing improvement. Hold regular review meetings to discuss results and next steps. Tools like Power BI, Tableau, and Google Data Studio make sharing interactive and actionable.

5 Essential Strategies for Effective Analytics & Reporting
Data Foundation & Quality
A strong analytics strategy starts with reliable data. Ensure a single source of truth by centralizing marketing and sales data. This prevents fragmented insights and conflicting conclusions.
Regularly clean and standardize your datasets. Remove duplicates and unify inconsistent formats, like dates or product codes, to avoid “garbage-in, garbage-out” errors.
Finally, prioritize data security. Use role-based access and simple row-level filters to protect sensitive information, ensuring data is safe without slowing down reporting.
Insight-Driven Reporting
Effective reporting goes beyond just showing trends—it explains why they happen. For instance, if video views are rising, suggest running an experimental campaign to produce more video content.
Frame your data within a storytelling structure. Highlight challenges, successes, and actionable recommendations, because humans process stories more effectively than raw numbers.
Context is critical. Always compare current figures to historical performance or industry benchmarks. This avoids misinterpretation and provides actionable insights.
Visualization & User Experience
Choose visuals that match your data. Use line charts for trends, bar charts for comparisons, and pie charts for parts of a whole. Avoid complex visuals in tools like Power BI to maintain fast load times.
Keep reports simple and focused. Limit KPIs to what matters most for your business objectives. Cluttered dashboards reduce attention and obscure key takeaways.
Use dynamic, interactive dashboards with tools like Tableau or Power BI. This allows stakeholders to explore data in real-time and make informed decisions faster.
Process & Workflow Optimization
Automate data collection whenever possible. Tools like Databox or Zoho Analytics can pull real-time updates, reducing manual errors and saving valuable time.
Set a consistent reporting schedule—weekly, monthly, or quarterly—so stakeholders know when updates are coming and can act promptly.
Implement feedback loops. Regularly ask stakeholders if reports are helping them make better decisions. Adjust the metrics and KPIs tracked based on their input to keep reporting relevant and effective.
Technical Performance (Power BI Specific)
Simplify data models to improve report speed. Complex DAX queries and large tables can slow performance. Using incremental refreshes helps keep reports responsive.
For large datasets, use aggregations or pre-summarized tables. This reduces load times and resource consumption, allowing users to interact with reports smoothly without delays.
Conclusion
Implementing proven analytics & reporting tips transforms your business data into actionable insights. By setting clear KPIs, selecting the right tools, automating reports, focusing on insights, reviewing regularly, and sharing effectively, you can boost performance and make smarter, data-driven decisions.
Start applying these strategies today to enhance performance tracking, increase ROI, and make every decision count.
FAQs
1. What is analytics & reporting in business?
Analytics & reporting is the process of collecting, analyzing, and visualizing data to track performance, uncover trends, and make informed decisions. It helps businesses improve efficiency and ROI.
2. Why is data quality important for reporting?
Accurate and clean data ensures reliable insights. Poor-quality data leads to incorrect conclusions, wasted resources, and ineffective decision-making. Centralized and standardized data prevent this.
3. What are the best tools for analytics & reporting?
Popular tools include Google Analytics, Tableau, Power BI, Zoho Analytics, and Databox. They help visualize data, automate reports, and track KPIs efficiently.
4. How can I make reports more insightful?
Focus on the “why” behind the numbers, not just the “what.” Add context, highlight trends, compare with historical performance, and provide actionable recommendations.
5. What are KPIs and why are they important?
KPIs (Key Performance Indicators) are measurable values that track progress toward business goals. Tracking KPIs helps identify success areas and gaps in performance.
6. How can I improve reporting dashboards?
- Use the right chart types (line for trends, bar for comparisons).
- Limit to essential KPIs.
- Implement interactive dashboards for real-time exploration.
7. How often should I review analytics reports?
Regularly review reports weekly, monthly, or quarterly. Frequent reviews help track trends, adjust strategies, and ensure reporting remains relevant.
8. How can automation improve analytics reporting?
Automating reporting saves time, reduces manual errors, and provides real-time insights. Tools like Databox and Zoho Analytics help streamline this process.
9. What are the best practices for data security in reporting?
Use role-based access, row-level security filters, and limit sensitive data exposure. This ensures reports remain fast and secure for stakeholders.
10. How do I make analytics & reporting more actionable?
Combine clean data, clear KPIs, insightful storytelling, and visual dashboards. Provide recommendations based on trends, and adjust strategies using feedback loops.